Search the blog
Tabla de contenidos
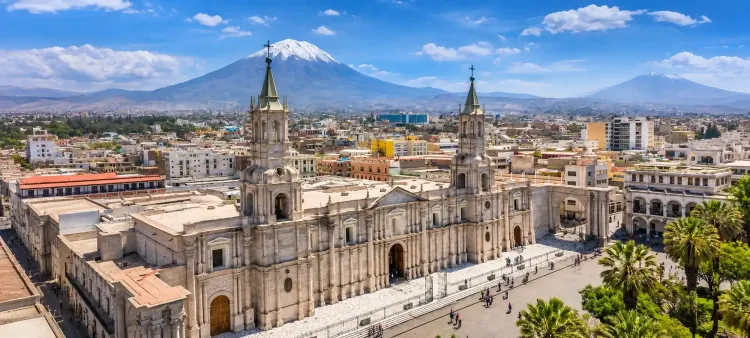
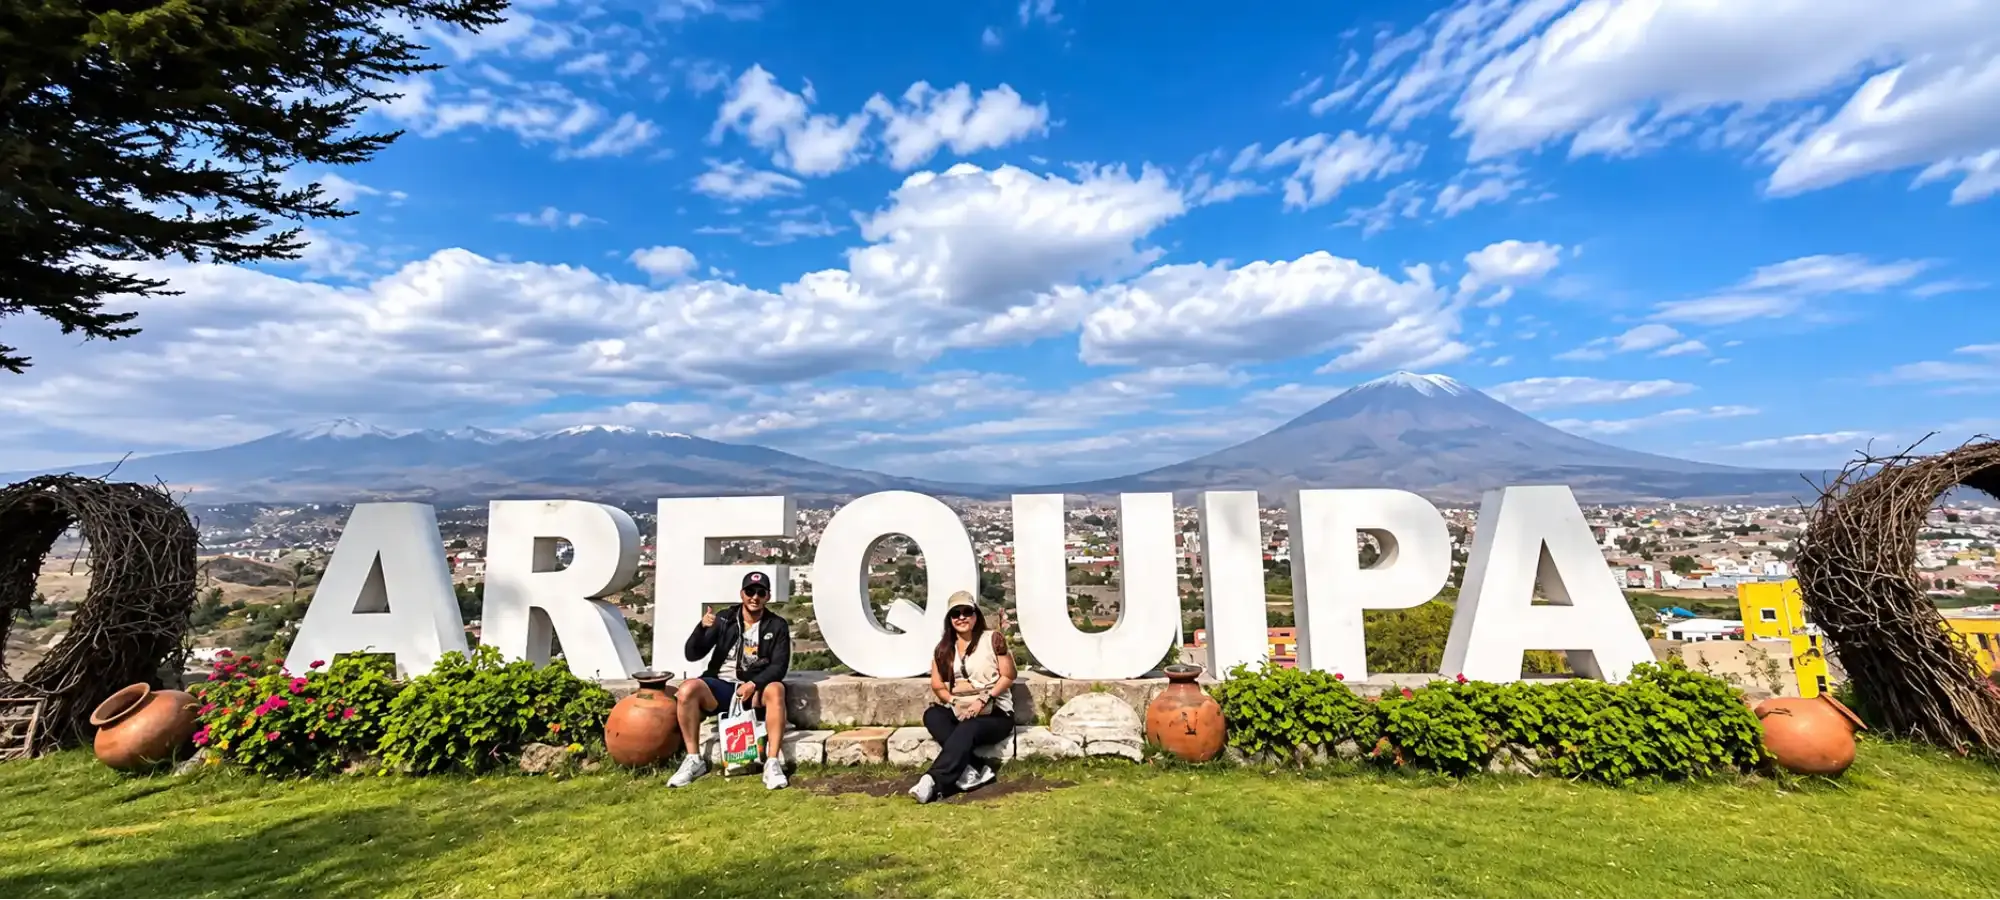
Understanding the weather in Arequipa is one of the most important steps when planning a trip to the White City. Although this southern Peruvian destination is famous for its sunny days and dry climate, temperatures change between day and night, and rainfall is concentrated mainly in certain months of the year.
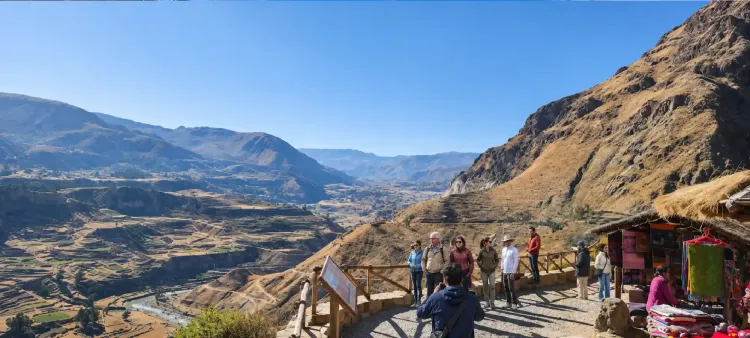
Located approximately 2,335 meters (7,661 feet) above sea level, Arequipa enjoys climatic conditions that make it possible to explore its historic streets, viewpoints, and monuments throughout much of the year. However, the weather can be very different when your journey continues into the mountains or toward Colca Canyon.
According to climate reference data published by Peru's National Meteorology and Hydrology Service (SENAMHI), Arequipa's average monthly high temperatures remain around 22 to 23°C (72 to 73°F), while average lows can drop to approximately 7°C (45°F) during the coldest months.
In this guide, you'll find detailed information about weather in Arequipa, including monthly temperatures and rainfall from January to December, seasonal differences, and the conditions you should consider when planning your sightseeing.
If you're preparing your trip, you can also explore our Arequipa tours, featuring experiences that introduce you to the city, its volcanic landscapes, and Colca Canyon.
What Is the Weather Like in Arequipa Throughout the Year?
Arequipa has a relatively dry climate, with many sunny days and a noticeable difference between daytime and nighttime temperatures. This characteristic is related to its location in the Andes and the geographical conditions of southern Peru.
Unlike coastal cities, where humidity can significantly influence how temperatures feel, Arequipa generally has a drier atmosphere. During the day, the sunlight can feel intense, while evenings and nights tend to be cooler.
Average monthly high temperatures change relatively little throughout the year. However, minimum temperatures show more noticeable differences, particularly during the Southern Hemisphere winter.
Rainfall also follows a seasonal pattern. Much of the annual precipitation occurs between December and March, while considerably drier conditions prevail from April to November.
These characteristics make it possible to organize tourist activities throughout the year, although schedules and clothing should be adapted to the conditions of each season.
To discover the main attractions you can visit in the city, we recommend our guide to 20 must-see places and things to do in Arequipa.
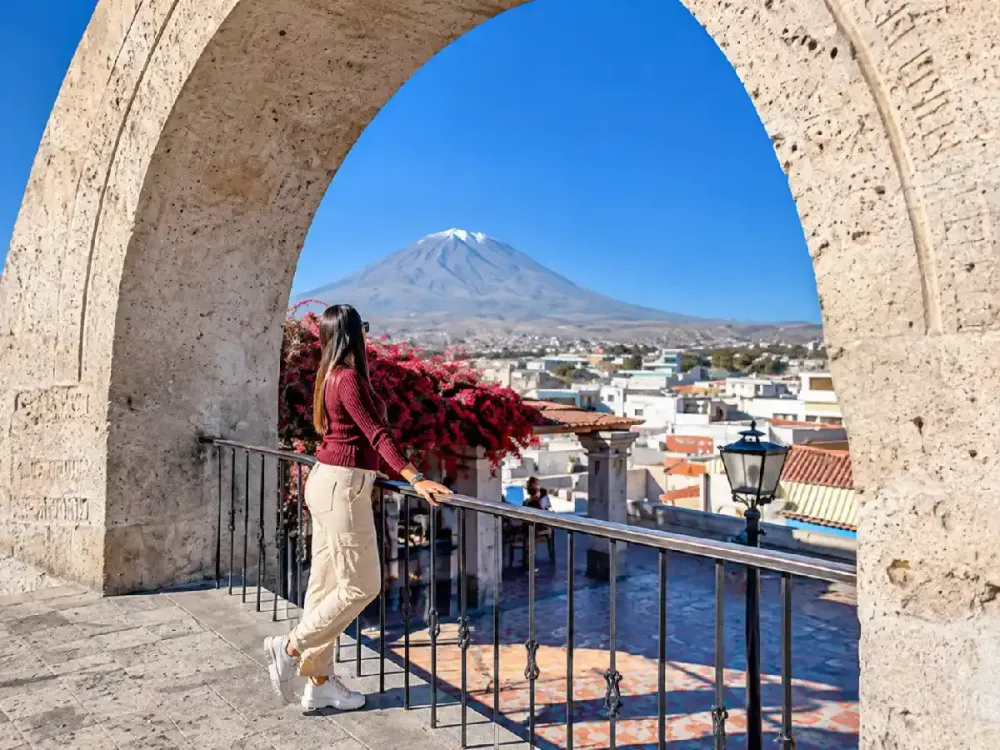
Arequipa Temperatures by Month: Average Highs and Lows
One of Arequipa's advantages is that average daytime high temperatures do not change dramatically between months. However, nights can be considerably colder, especially between May and August.
According to the climate reference values published by SENAMHI for Arequipa, October records the highest average monthly maximum temperature at 23.2°C (73.8°F), while July has the lowest average monthly minimum at 6.9°C (44.4°F).
The following table compares the average high and low temperatures for each month, together with the reference monthly rainfall.
| Month | Average high | Average low | Approximate monthly rainfall |
|---|---|---|---|
| January | 22.1°C (71.8°F) | 10.9°C (51.6°F) | 21 mm |
| February | 22.1°C (71.8°F) | 11.2°C (52.2°F) | 28 mm |
| March | 22.3°C (72.1°F) | 10.6°C (51.1°F) | 16 mm |
| April | 22.8°C (73.0°F) | 9.8°C (49.6°F) | 1 mm |
| May | 22.8°C (73.0°F) | 8.2°C (46.8°F) | 0 mm |
| June | 22.8°C (73.0°F) | 7.2°C (45.0°F) | 0 mm |
| July | 22.6°C (72.7°F) | 6.9°C (44.4°F) | 0 mm |
| August | 22.9°C (73.2°F) | 7.8°C (46.0°F) | 1 mm |
| September | 23.1°C (73.6°F) | 8.4°C (47.1°F) | 0 mm |
| October | 23.2°C (73.8°F) | 9.1°C (48.4°F) | 0 mm |
| November | 23.0°C (73.4°F) | 9.4°C (48.9°F) | 1 mm |
| December | 22.6°C (72.7°F) | 10.2°C (50.4°F) | 3 mm |
Source: Monthly climate reference values published by SENAMHI for Arequipa. Precipitation figures are rounded to the nearest millimeter and do not represent forecasts for any specific year.
It's important to interpret these figures correctly. The high and low temperatures shown in the table are monthly climate averages, not the absolute extremes that might occur on a particular day.
Likewise, a rainfall value close to zero does not mean that rain is impossible. It represents a very small monthly amount within the climate records used as a reference.
For travelers planning outdoor activities, these figures help identify when colder mornings are more likely and which months require additional consideration because of potential rainfall.
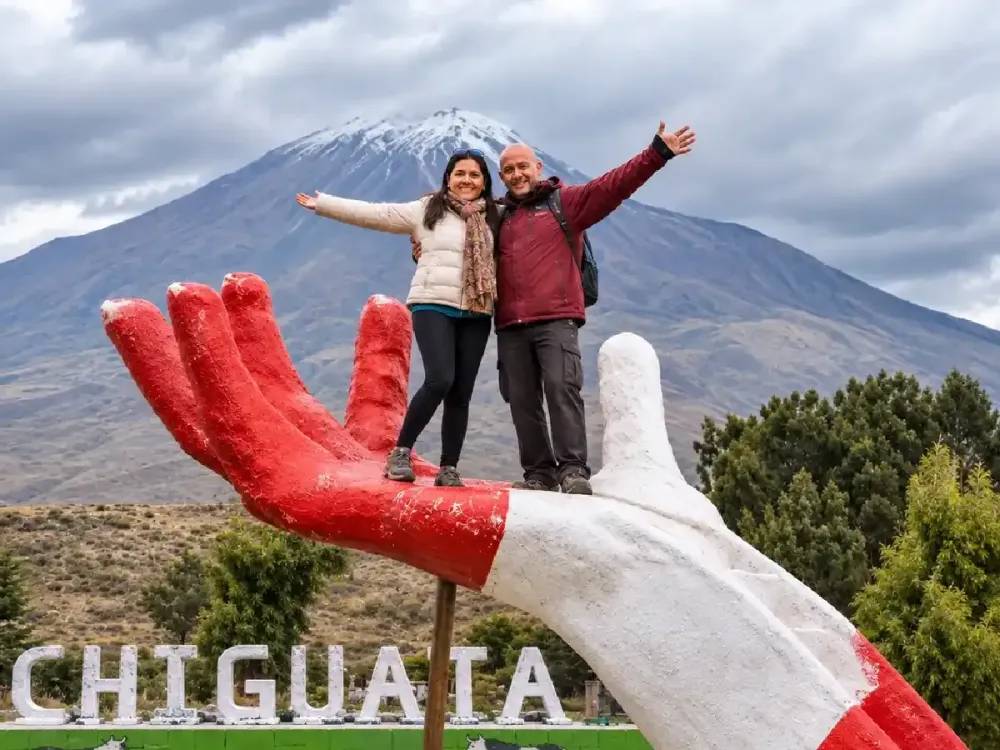
When Does It Rain Most in Arequipa, and Which Months Are Dry?
Rainfall in Arequipa is concentrated mainly during the Southern Hemisphere summer, particularly between January and March. February stands out as the month with the highest rainfall in the climate reference data.
During this period, days may bring cloud cover, rainfall of varying intensity, and changing sky conditions. However, this does not necessarily mean it will rain throughout the entire day.
From April onward, the records show a considerable decrease in precipitation. Between May and October, average monthly rainfall is very low, although occasional rain remains possible.
This seasonal distribution explains why Arequipa is considered a dry-climate city for much of the year. It also helps explain the differences between its urban landscape and the surrounding high-Andean areas.
Rainfall does not always affect every part of the region in the same way. While light precipitation may occur in central Arequipa, conditions can be very different at higher elevations.
If your itinerary includes excursions outside the city, we recommend checking forecasts for each destination rather than relying exclusively on weather data from central Arequipa.
You can learn more about the region's landscapes in our complete Colca Canyon guide, which explains the characteristics of this important natural destination.
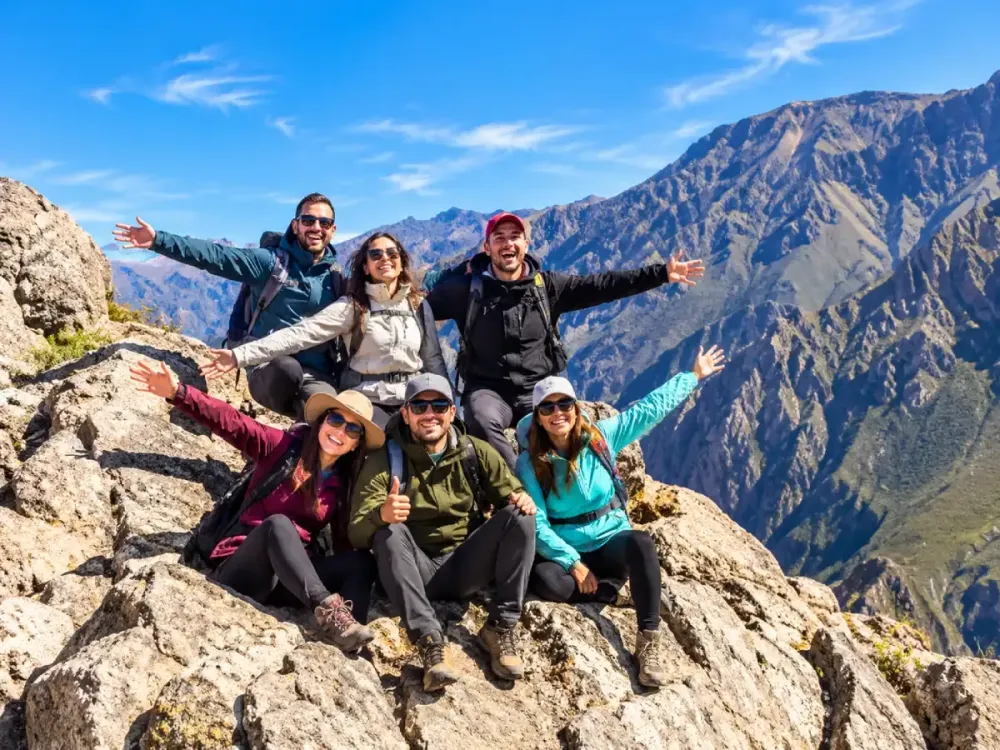
Arequipa Weather from January to March: The Rainiest Months
January through March is generally the wettest period in Arequipa. During these months, average nighttime lows are relatively milder than in winter, but cloud cover and rain can influence the sightseeing experience.
In January, the average high temperature is approximately 22.1°C (71.8°F), while the average low reaches 10.9°C (51.6°F). Reference monthly rainfall is around 21 mm, so it's advisable to keep outdoor plans somewhat flexible.
February is the rainiest month in the climate series consulted. With approximately 28 mm of precipitation, changing weather conditions may occur, particularly affecting travelers taking road excursions.
In March, rainfall begins to decrease gradually. The average high temperature is around 22.3°C (72.1°F), while reference monthly precipitation drops to approximately 16 mm.
During this period, we recommend taking advantage of favorable weather windows to explore the historic center and keeping cultural activities as alternatives if conditions change.
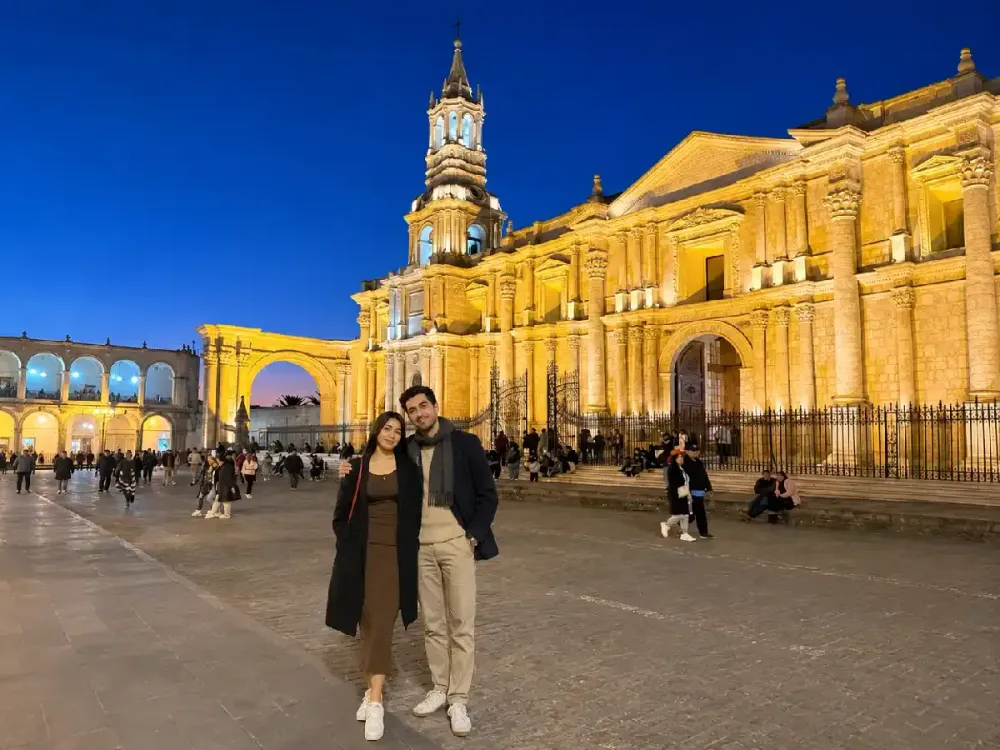
Plaza de Armas in Arequipa is an excellent starting point for discovering nearby monuments, architecture, and cultural attractions.
You can also explore Santa Catalina Monastery in Arequipa, one of the White City's most representative historic complexes.
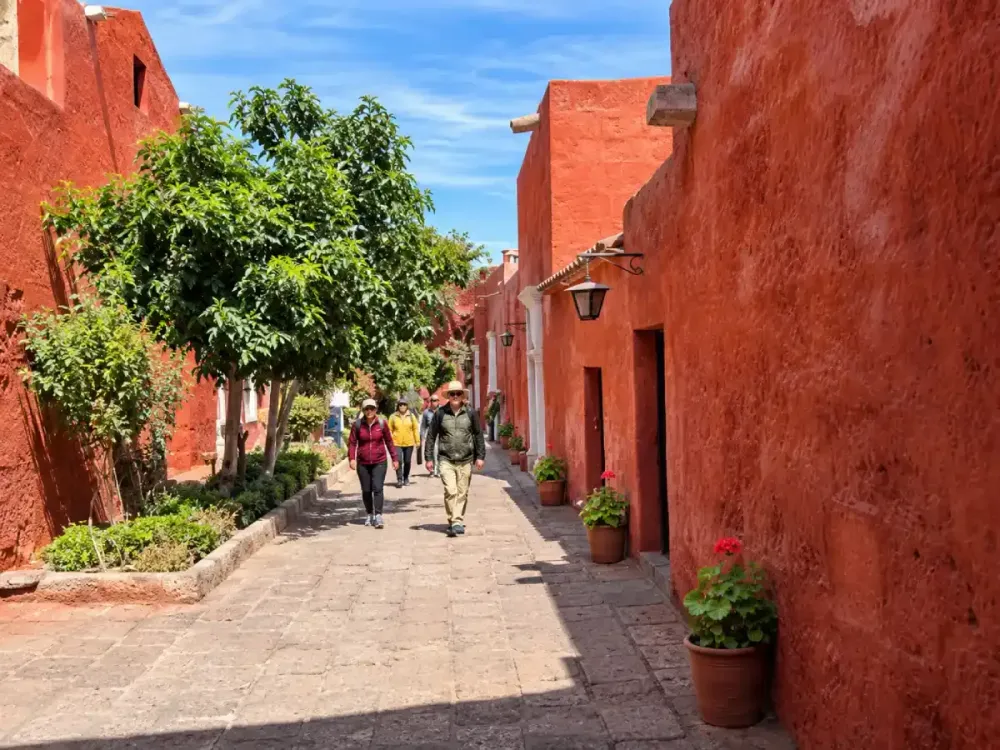
Arequipa Weather in April and May: Rainfall Decreases
April marks the transition toward drier conditions in Arequipa. Reference monthly rainfall falls to approximately 1 mm, while the average high temperature remains around 22.8°C (73.0°F).
Although weather changes may still occur on certain days, conditions generally become more favorable for exploring squares, churches, viewpoints, and traditional neighborhoods.
In May, average monthly precipitation is practically zero in the climate table consulted. Average high temperatures remain around 22.8°C (73.0°F), while average lows fall to approximately 8.2°C (46.8°F).
This combination of mild days and cool nights is important when choosing appropriate clothing. Light layers may be comfortable for daytime walks, but a jacket becomes useful toward the end of the day.
April and May also provide opportunities to admire the volcanoes surrounding the city, provided that sky conditions allow good visibility.
If you'd like to enjoy these landscapes, we recommend visiting Yanahuara Viewpoint, famous for its sillar stone arches and views of Misti Volcano.
At Dreamy Tours, we believe these months generally allow cultural and scenic tours to be organized comfortably, while remembering that weather conditions can still change.
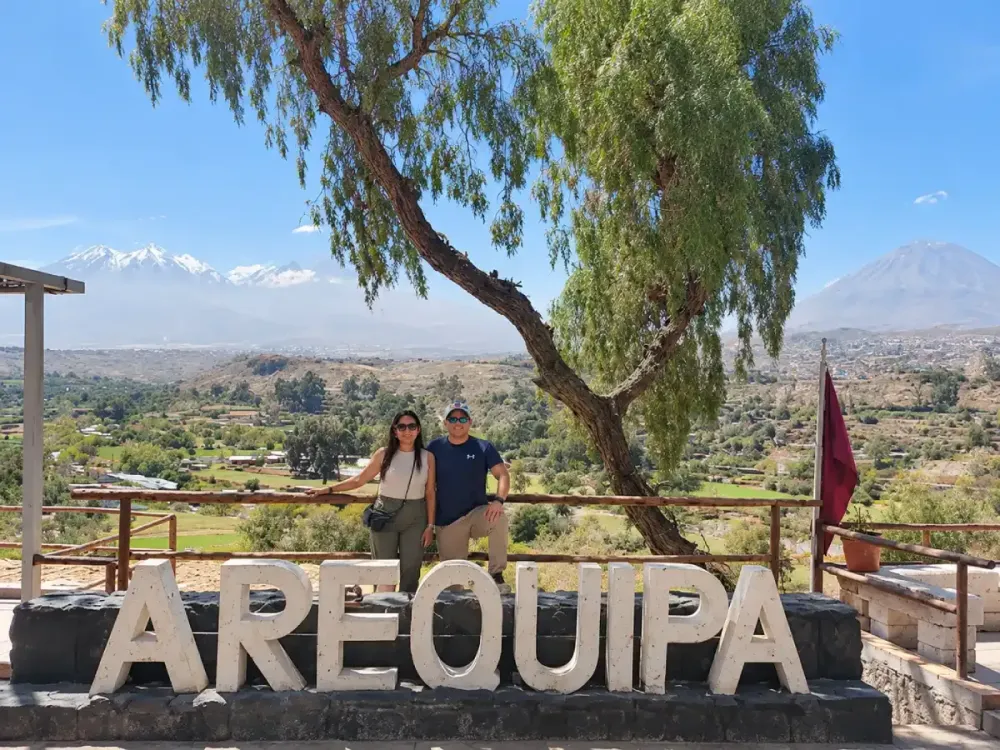
Arequipa Weather from June to August: Dry Days and Cold Nights
Between June and August, Arequipa experiences generally dry conditions, along with some of the lowest nighttime temperatures of the year.
In June, the average high remains around 22.8°C (73.0°F), while the average low drops to approximately 7.2°C (45.0°F). July records the lowest value in the monthly series, with an average minimum of 6.9°C (44.4°F).
August brings a slight increase in average minimum temperatures to approximately 7.8°C (46.0°F), although mornings and evenings may still feel cold.
This temperature difference is one of the characteristics that surprises first-time visitors. During the day, exposure to the sun can create a pleasantly warm feeling, while warmer clothing becomes necessary after sunset.
Rainfall is very low during these months, generally favoring outdoor sightseeing and panoramic activities.
However, dry weather should not be confused with warm temperatures throughout the day. Arequipa's altitude and changes in solar radiation mean that conditions can vary significantly between morning, midday, and night.
If you're planning to explore the city center after sunset, read our guide to things to do in Arequipa at night for recommended cultural activities and places to visit.
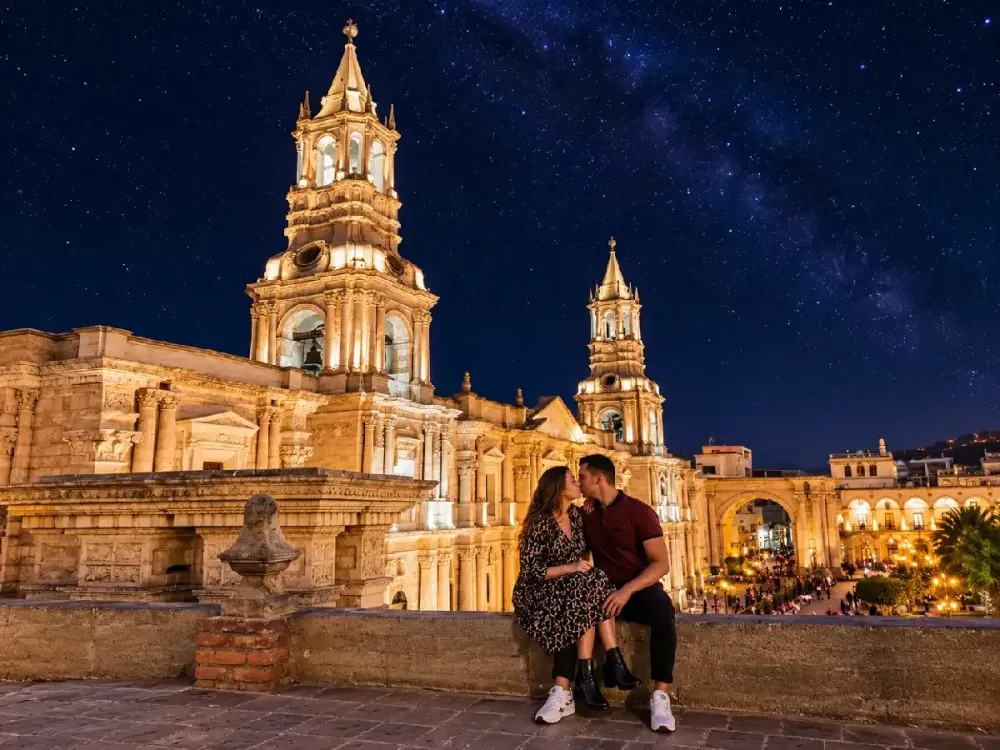
Arequipa Weather from September to November
Between September and November, Arequipa's average high temperatures rise slightly, while rainfall remains very limited.
September records an average high of approximately 23.1°C (73.6°F) and an average low of 8.4°C (47.1°F). Conditions generally remain dry, making it easier to organize city sightseeing and panoramic excursions.
October has the highest average monthly maximum temperature in the reference table, at 23.2°C (73.8°F). However, this does not necessarily mean it has the hottest individual days, as actual temperatures can vary.
In November, the average high decreases slightly to 23.0°C (73.4°F), while the average low is around 9.4°C (48.9°F). The likelihood of precipitation gradually begins to increase as the Southern Hemisphere summer approaches.
For travelers interested in photography, these months can be appealing because of the combination of sunshine and relatively dry conditions.
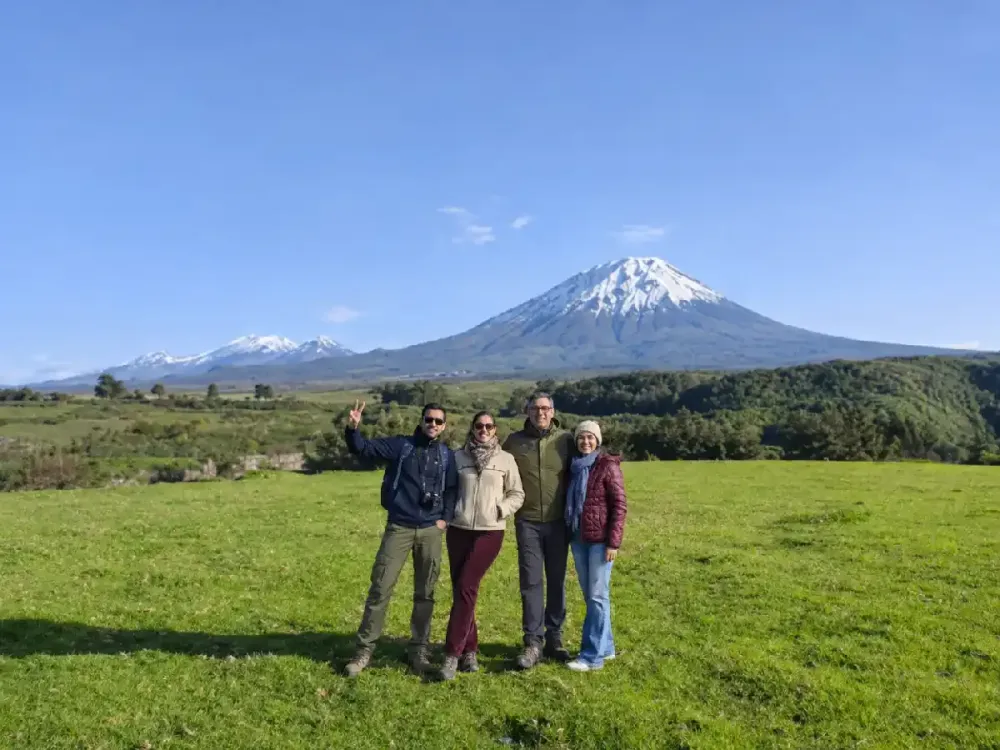
One of the most recognizable landscapes is Misti Volcano, whose silhouette dominates Arequipa's skyline. Learn more about its location, elevation, and main viewing spots in our Misti Volcano in Arequipa guide.
At Dreamy Tours, we recommend making the most of clear mornings to visit viewpoints, especially when your main goal is photographing the volcanoes.
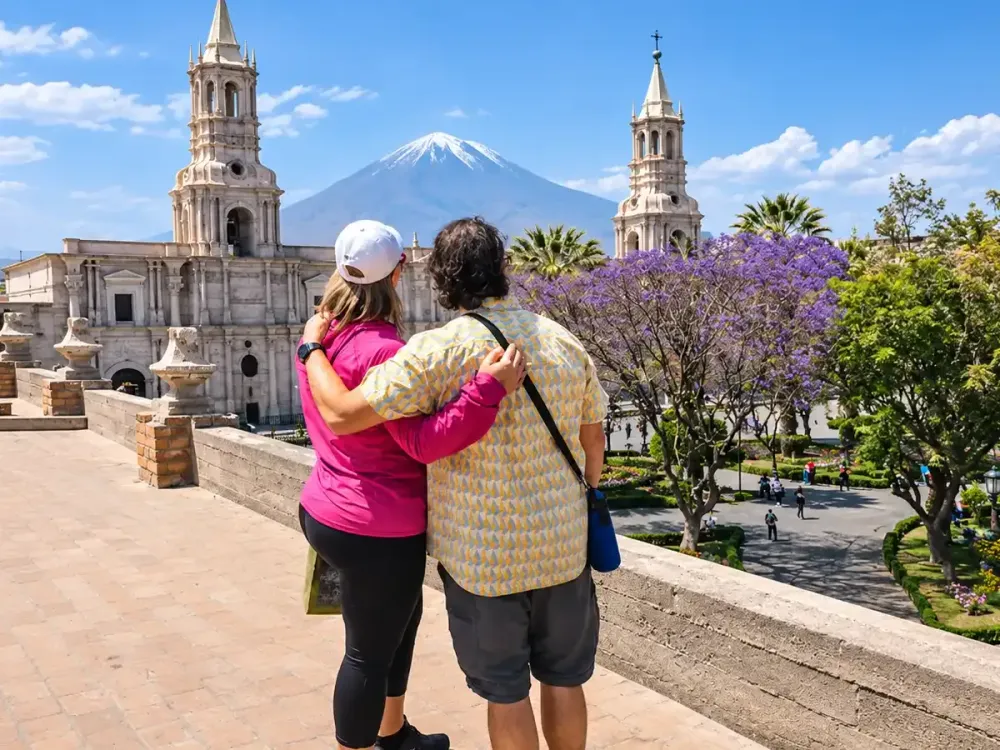
Arequipa Weather in December: Transition to the Rainy Season
December marks the beginning of a transition toward wetter conditions in Arequipa. Although average reference precipitation remains relatively low, the likelihood of rain increases as the season progresses.
The average monthly high is around 22.6°C (72.7°F), while the average low reaches approximately 10.2°C (50.4°F). These figures show that nights are generally less cold than during the middle of the Southern Hemisphere winter.
Reference monthly rainfall is approximately 3 mm, although actual amounts can vary considerably between years.
For travelers visiting during the December holidays, we recommend checking the forecast before scheduling excursions and considering alternatives in case weather conditions change.
The city offers many cultural activities that can be combined with outdoor sightseeing. If you're short on time, our Arequipa in One Day guide suggests a route through the city's most representative monuments and attractions.
December can also be an opportunity to discover local gastronomy and enjoy the city with a flexible itinerary.
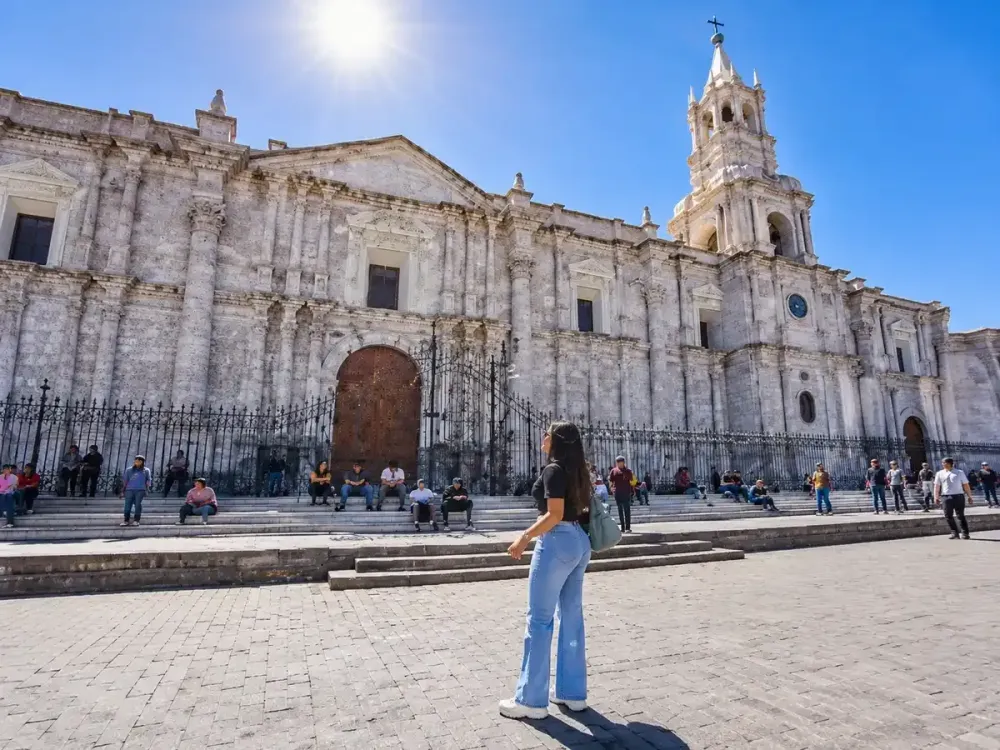
Daytime and Nighttime Temperature Differences in Arequipa
One of the most important features of Arequipa's climate is the difference between its usual high and low temperatures.
During certain months, average highs remain close to 23°C (73°F), while average lows drop to approximately 7°C (45°F). This represents a considerable temperature range within the same daily cycle.
Solar radiation, altitude, and atmospheric conditions influence these variations. During the day, sun-exposed areas may feel warm, but temperatures can drop quickly as evening approaches.
For this reason, we recommend dressing in layers. A T-shirt or lightweight top may be comfortable at midday, while a jacket helps you adapt to cooler evening temperatures.
It's also important to use sunscreen, sunglasses, and a hat during outdoor activities. Cool air does not eliminate exposure to ultraviolet radiation.
Travelers planning to walk for several hours should carry drinking water and take breaks when necessary, particularly if they are still adjusting to the altitude.
These recommendations are useful when exploring the historic center, public squares, viewpoints, and other outdoor locations.
How Weather Affects Viewpoints, Misti Volcano, and Ruta del Sillar
Weather conditions directly influence the experience of visiting Arequipa's viewpoints and outdoor attractions.
At Yanahuara Viewpoint, visibility of Misti Volcano depends mainly on cloud cover. On clear mornings, the sillar stone arches provide opportunities to capture panoramic photographs of one of the city's most representative landscapes.
Carmen Alto Viewpoint offers a different perspective, overlooking the Chilina Valley, agricultural areas, and surrounding mountains.
In both cases, dry weather can make sightseeing more enjoyable, but it does not guarantee that the volcanoes will remain fully visible. Conditions may change even within a single day.
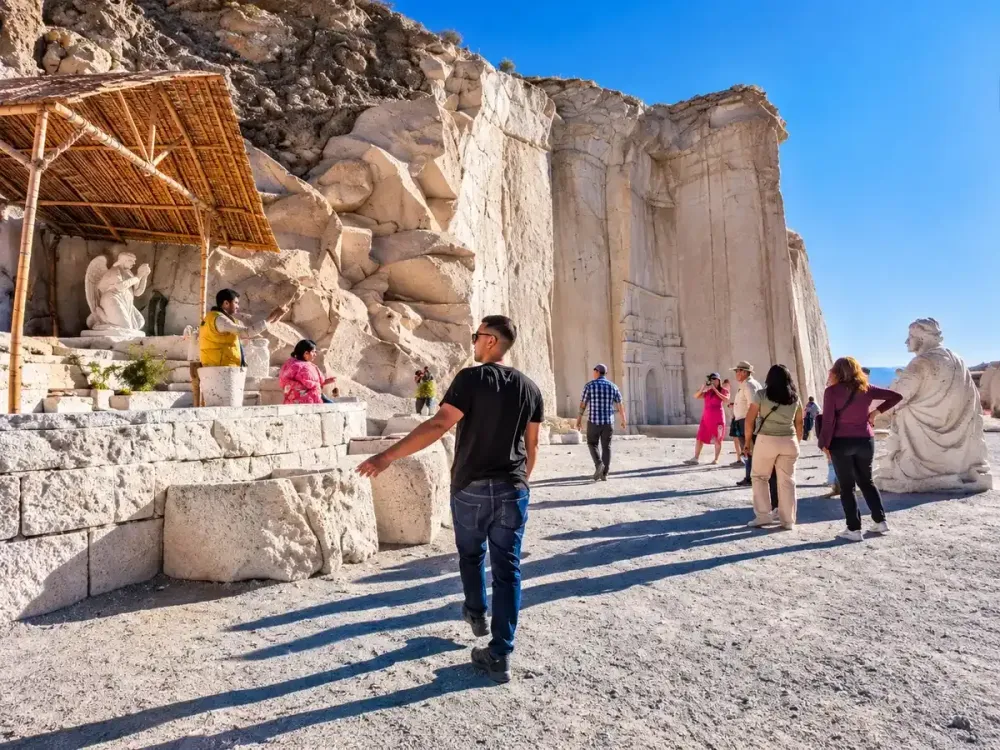
The Ruta del Sillar in Arequipa also takes place in outdoor settings, so sunscreen, drinking water, and comfortable shoes are recommended.
During months with a higher probability of rainfall, we recommend confirming tour conditions before traveling to the quarries.
You can explore these locations with our Ruta del Sillar Tour in Arequipa, which introduces visitors to areas associated with the extraction and traditional craftsmanship of volcanic stone.
If you'd like to combine viewpoints with historic monuments, our Arequipa City Tour is an option for organizing visits with transportation and tourist assistance.
Differences Between the Weather in Arequipa City and Colca Canyon
Although Arequipa city and Colca Canyon belong to the same region, they experience important climate differences due to altitude and the geographical characteristics of each area.
Arequipa city is located approximately 2,335 meters (7,661 feet) above sea level. By comparison, Chivay stands at around 3,600 meters (11,811 feet), and certain sections of the road toward Colca reach elevations close to 4,800 meters (15,748 feet).
These differences can produce considerably lower temperatures in high-Andean areas, especially before sunrise and after sunset.
For this reason, the temperature and rainfall figures in the monthly table for Arequipa city should not be used as direct references for the Colca Valley.
During dry months, trips through Colca may offer clear skies but also very cold mornings. In rainy months, the landscape may turn greener, while road conditions and visibility can vary.
If you're planning to visit Chivay, we recommend reading our guide to Chivay and La Calera Hot Springs, which explains the characteristics of this destination.
You can also visit Cruz del Cóndor, one of the canyon's most important viewpoints, where weather conditions may influence condor sightings.
For travelers who prefer a more relaxed itinerary, our 2-Day Colca Canyon Tour allows you to explore different landscapes in the valley and spend one night in the area.
How to Check the Weather Forecast and Plan Your Arequipa Tours
Climate averages help explain how the weather typically behaves throughout the year, but they do not replace forecasts for specific travel dates.
Before traveling, we recommend checking SENAMHI's official forecast and reviewing the conditions for the destinations you intend to visit.
It's important to distinguish between a monthly average temperature and a forecast for a particular day. For example, although February typically receives the most rainfall, this does not mean that every day in February will be rainy. Similarly, an otherwise dry month can still experience isolated changes in weather.
For sightseeing in the city, you can organize visits to Plaza de Armas, Santa Catalina Monastery, and Yanahuara and Carmen Alto viewpoints, adjusting the schedule according to the day's conditions.
If you have more time, you can include Colca Canyon or Ruta del Sillar. Our guide to what to see in Arequipa in 1, 2, and 3 days will help you organize your experiences.
If your itinerary continues to other regions of Peru, you can also read our article on the best time to visit Peru, where we explain the climate differences between the country's main destinations.
At Dreamy Tours, we recommend planning each day according to the weather forecast, altitude, available time, and tour conditions. Arequipa can be visited throughout the year, but understanding its climate helps you better enjoy its landscapes and cultural heritage.
If you're preparing your next adventure, discover our Arequipa and Colca Canyon tours and choose the experiences that best match your interests and travel style.
Personal travel advice
Plan your trip with Dreamy Tours
Start a tailored journey with our exclusive tours and custom trips across Peru and other Latin American countries.